Examine API Performance through Realistic Traffic Simulation with Postman

API performance testing: What and Why?
In the fast-moving digital age, creating a great user experience is key for any business to thrive. Picture APIs as the engine running behind the scenes in modern companies. It's important to check that your product works correctly (functional testing) and can handle a bunch of users without a hiccup (performance testing) to ensure happy customers
API performance testing involves simulating real-world traffic and observing your API’s resulting behaviour. It is conducted to evaluate how well an API meets performance expectations for response time, throughput, and availability under the simulated load.
API performance testing serves several crucial purposes:
- Handle Expected Load: It ensures that your API can effectively manage the anticipated load (load represents the number of parallel users interacting with your APIs concurrently).
- Optimize User Experience: By pinpointing areas for improvement, API performance testing helps optimize the overall performance of your API. This optimization is essential for delivering a smoother and more satisfying user experience.
- Detect Bottlenecks and Latency: The testing process helps identify any bottlenecks, latency issues, or failures within the system. Understanding these aspects is vital for refining the efficiency of your API.
- Determine System Scalability: API performance testing provides insights into the scalability of your system. By evaluating how well your API handles increased load, you can make informed decisions about the system's ability to scale as demands grow.
API Performance testing Using Postman
Postman has integrated features to facilitate the testing of your API's performance using your existing Postman Collections and requests. In this post, we'll delve into two key functionalities:
- Simulating Load with Postman: You can use Postman to replicate load by having multiple virtual users simultaneously interact with your endpoints.
- Real-time Visualization of API Performance: Witness the performance of your APIs in real time under simulated loads. We'll guide you on monitoring response times, throughput (requests per second), and error rates, providing insights into your API performance metrics.
How to use Postman for API Performance Testing
Creating a performance test in Postman is a breeze with the Collection Runner. Just follow these steps to get started:
Step 1: Select a Collection in Postman and Click Run.
NOTE: It's important to be aware that Postman will execute not only your requests but also any pre-request and test scripts associated with them.
Step 2:Select the Functional Tab under Runner and check whether the api is working or not.
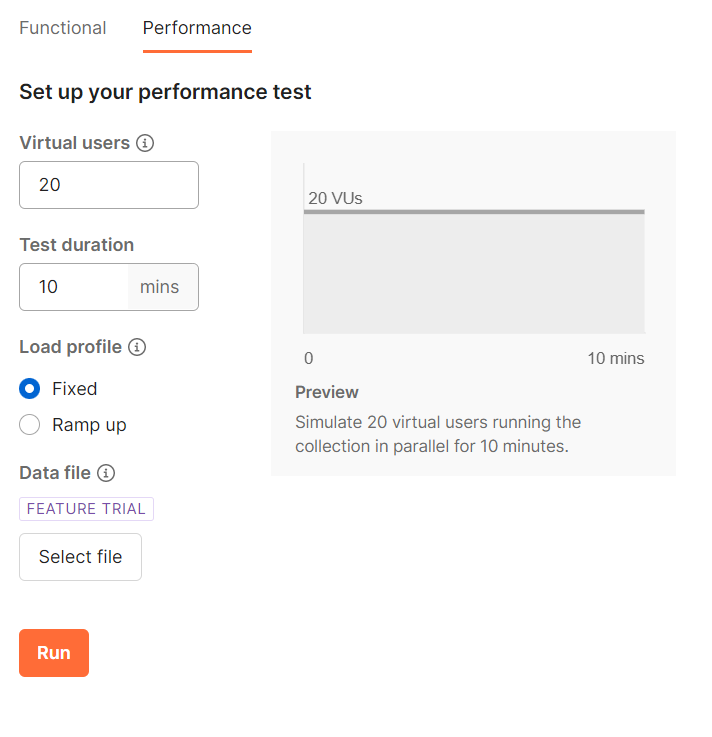
Step 3: Select the Performance tab under Runner, specify the load settings, and click Run
Step 4: Monitor the real-time response times and error rate closely.
Step 5: Upon completion of the run, assess and identify any bottlenecks in response times and the number of requests per second.
How to Configure the load in Postman to simulate real world traffic
You can now use the Collection Runner to simulate real-world traffic. You will be able to specify the following inputs to simulate the load condition:
- Virtual users (VUs): Virtual users are the parallel users that will hit your APIs at the same time. Each virtual user executes the selected sequence of requests in the collection in serial order as represented on the Collection Runner. Multiple virtual users will run this sequence in parallel, creating a load for your API workflows.
NOTE: Please note that since the virtual users are being simulated locally, there is a limit to the numbers you can simulate without running into memory or other issues. Initially Postman provides 100 Virtual Users(VUs)
- Test duration: The amount of time (in minutes) for which you want to run the test.
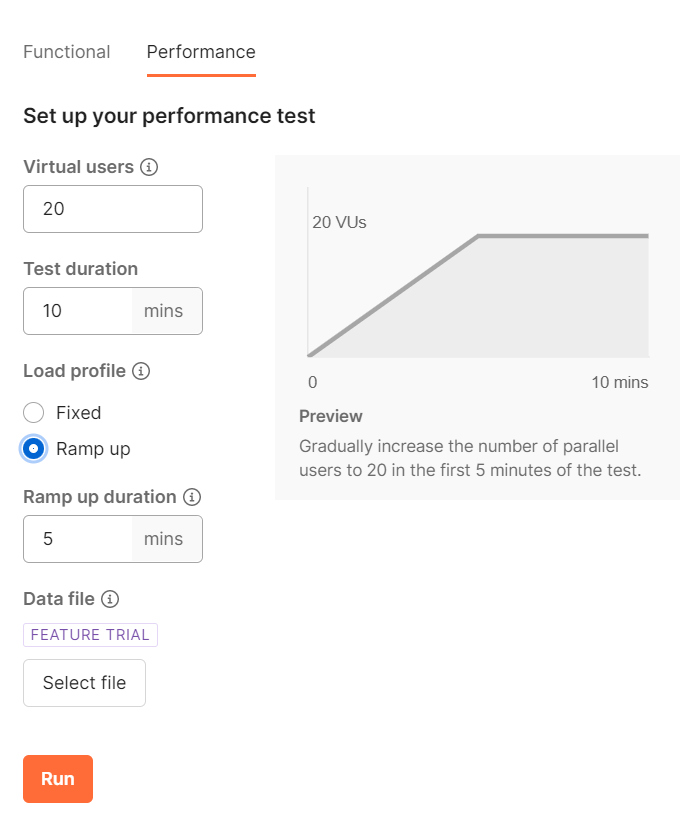
- Load profile: The intensity of the load during the test’s duration. We currently support two load profiles:
1) Fixed Load Profile: This will apply a fixed number of virtual users throughout the test duration.
2) Ramp up load profile: This will slowly increase the number of virtual users during the test duration to reach the specified load. Once reached, this number of virtual users will be maintained for the remaining test duration.
Visualizing the metrics of a performance test
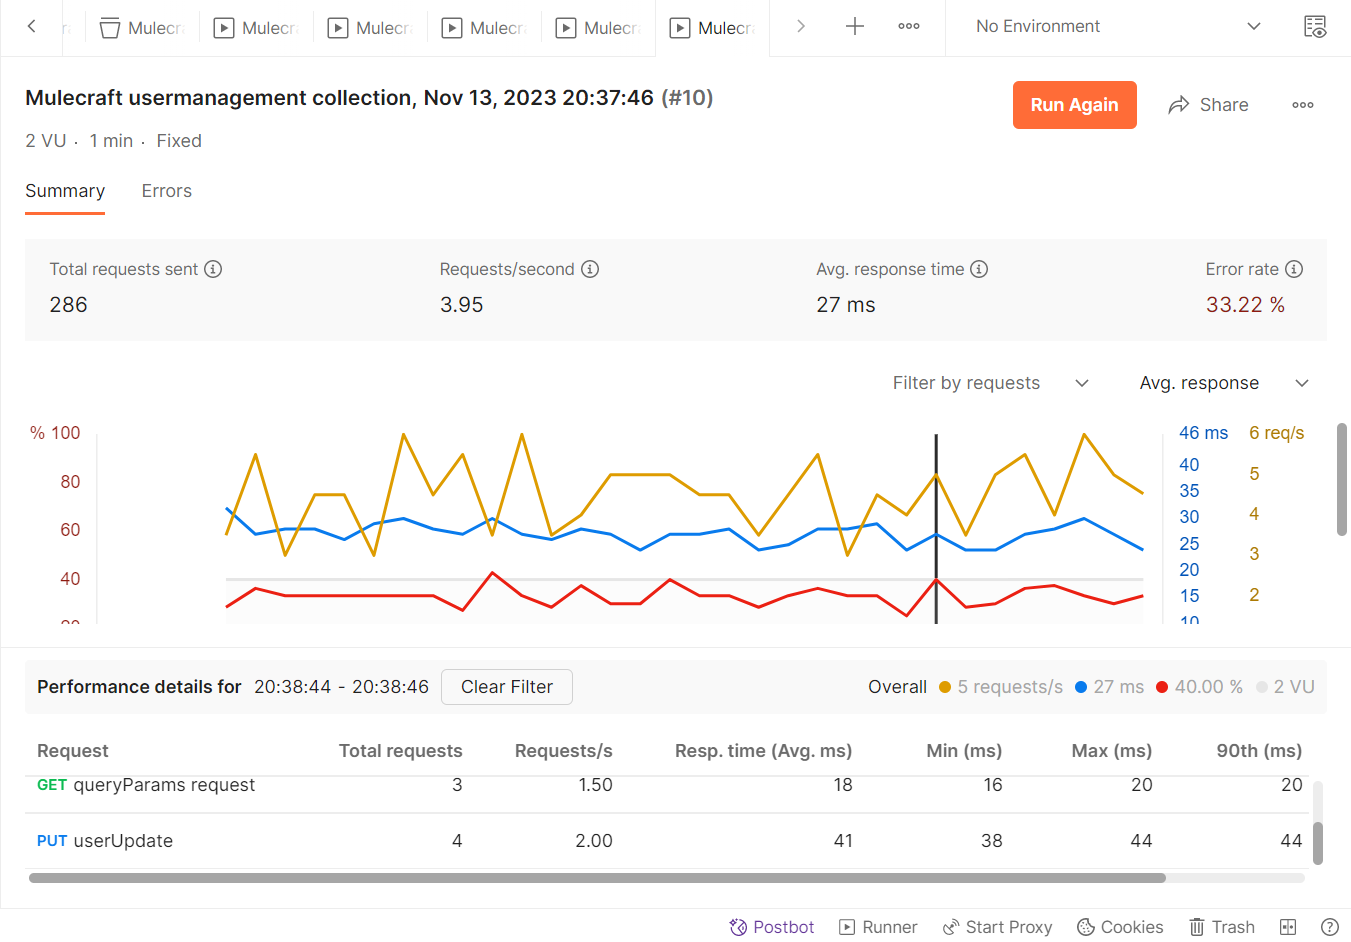
As soon as the performance test starts, you will be able to visualize and observe the performance of your APIs. Postman will show the following metrics in real time:
- Average response time: This is the average of the response times received for the multiple parallel virtual users across the various requests.
- Requests per second: You can monitor how many requests your API can handle in a second with the aid of the requests per second (throughput) indicator. Every virtual user is constantly pinging your endpoints, and each one can send several requests in a single second, contingent on response times. For instance, you may get, at most, 25 requests per second if you put up 5 virtual users to test a GET request with a response time of about 100 ms. However, the response time of your API and other variables, such the usage of pre-request or test scripts, will determine the practical number of request hits per second.
- Error rate: This metric indicates the fraction of the requests that get a non-200 response or face non-HTTP errors while sending the request.
Fixing mistakes in your performance test runs:
When your performance tests indicate elevated error rates and you would like to know more, you can simply hover over the point of interest and see what’s causing the spike. This helps you identify the cause of the error and troubleshoot the problem further, as shown below:
Once the run is complete, you can click on the Errors tab to view the detailed error rate.
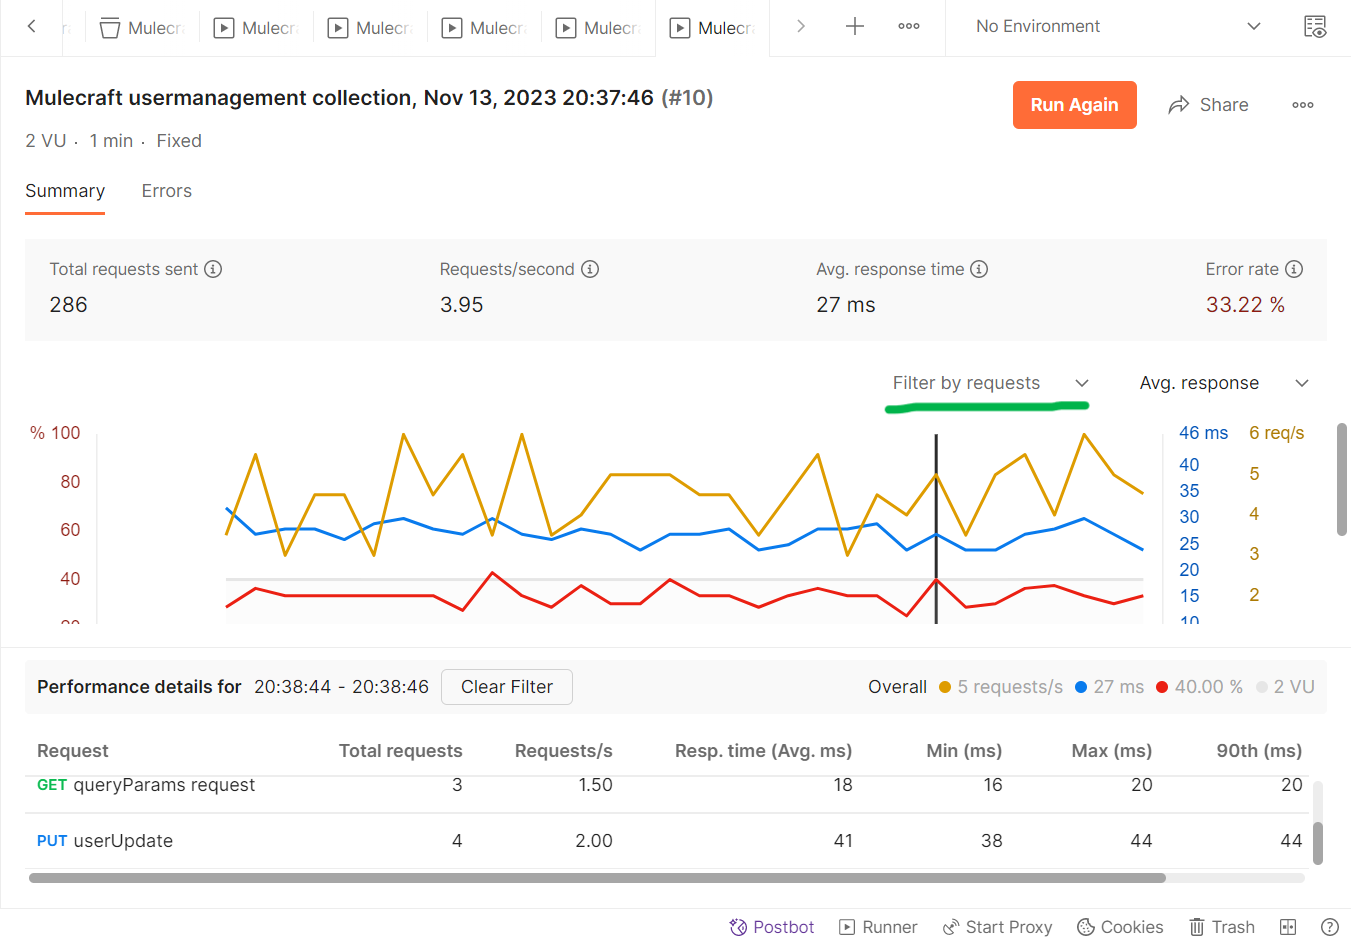
Dive into your metrics by request
Request lets you drill down into every request that has been executed by the many virtual users. This helps you identify which request could have contributed to a spike in the commutative average response times, enabling you to fix the problem.
You can also visualize the performance metrics of individual requests by selecting the required request in the available filter.
Viewing past performance test runs
You can view the list of past performance test runs for a collection, as shown below:
In conclusion, Postman is crucial for API performance testing, streamlining the process with its user-friendly interface and powerful features like the collection runner. Setting clear objectives and creating realistic scenarios enables swift bottleneck identification, ensuring optimal API performance. Regular testing is essential for early issue detection, contributing to a resilient API infrastructure and high-quality applications in today's dynamic digital landscape.