Load & Performance Testing Using Apache Jmeter For Mulesoft API


Apache JMeter is a Java-based open-source software crafted for gauging and evaluating the performance of web applications. It was originally developed by Stefano Mazzocchi of the Apache Software Foundation. JMeter can be used to simulate a heavy load on a server, network, or object to test its strength or to analyze overall performance under different load types.
Here are some key aspects of Apache JMeter:
Performance Testing: JMeter is primarily used for performance testing of web applications, but it can also be used to test the performance of FTP, databases, LDAP and other server types.
User-Friendly GUI: JMeter provides a user-friendly graphical user interface (GUI) that allows testers to create and configure test plans easily. Test plans are composed of thread groups, samplers, listeners and other elements.
Reporting: JMeter provides various reporting options, including real-time result visualization during the test and the ability to save test results for later analysis.
Open Source: Apache JMeter is an open-source project released under the Apache License 2.0. This means it is freely available for use, modification and distribution.
Test Elements:
Thread Group: Represents a virtual user group and defines the number of users and the ramp-up period.
Samplers: Simulate requests to the server, such as HTTP requests, FTP requests, JDBC requests, etc.
Listeners: Collect and display results in various formats (e.g., tables, graphs, trees) for analysis.
Controllers: Control the flow of the test plan execution.
Assertions: Define criteria for determining the success or failure of a test.
Timers: Introduce delays between requests to simulate real-world scenarios.
Protocols Supported: JMeter supports a variety of protocols, including HTTP, HTTPS, FTP, JDBC, LDAP, SOAP, JMS, SMTP, POP3, and more.
Scripting: While JMeter allows for test plan creation through the GUI, it also supports scripting for advanced users. Test plans can be saved in XML format and edited directly.
Distributed Testing: JMeter supports distributed testing, allowing multiple JMeter instances to be connected to simulate a large number of virtual users.
Plugins: JMeter has a plugin architecture that allows users to extend its capabilities. There are several third-party plugins available to enhance functionality.
JMeter is widely used in the software testing community for performance testing, load testing and stress testing of web applications. It has become a standard tool for assessing the performance and scalability of web servers and applications.
About Load Testing:
Load testing for MuleSoft APIs is a crucial practice to ensure the robust performance and scalability of integration solutions. Apache JMeter stands out as the preferred choice among testers globally when it comes to conducting load and performance testing.
It simulates various levels of concurrent user activity to evaluate the API's response under different loads. The process involves configuring virtual users, defining realistic test scenarios, handling authentication mechanisms, and monitoring key metrics such as response times and error rates.
Through iterative testing, teams can identify performance bottlenecks, optimize configurations, and validate that the MuleSoft APIs can meet the anticipated user demands while maintaining stability and responsiveness. This proactive approach helps organizations deliver reliable and high-performing APIs, ultimately enhancing the overall efficiency of their integration solutions.
How to perform load testing for your Mule Application?
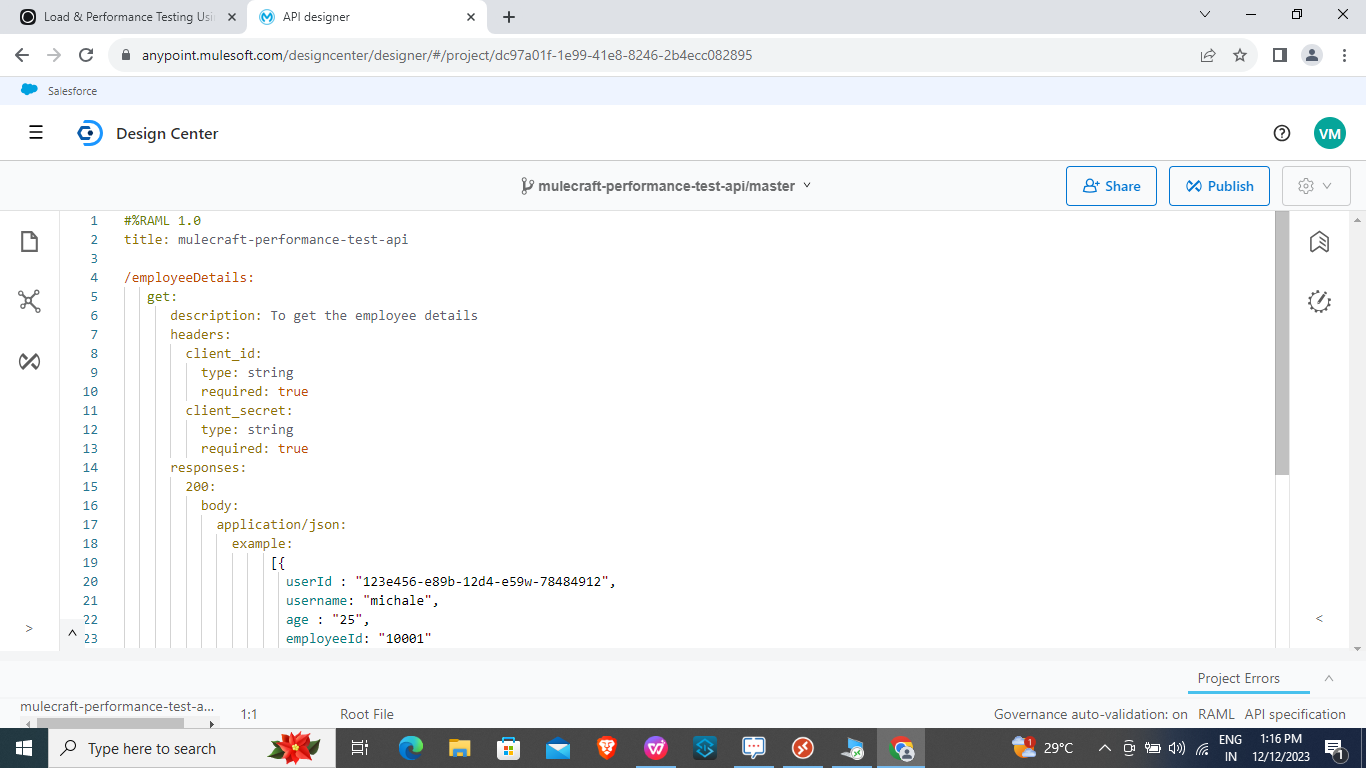
First you need to create a sample API. This API is used to get the user details from the database. Here is the RAML for it
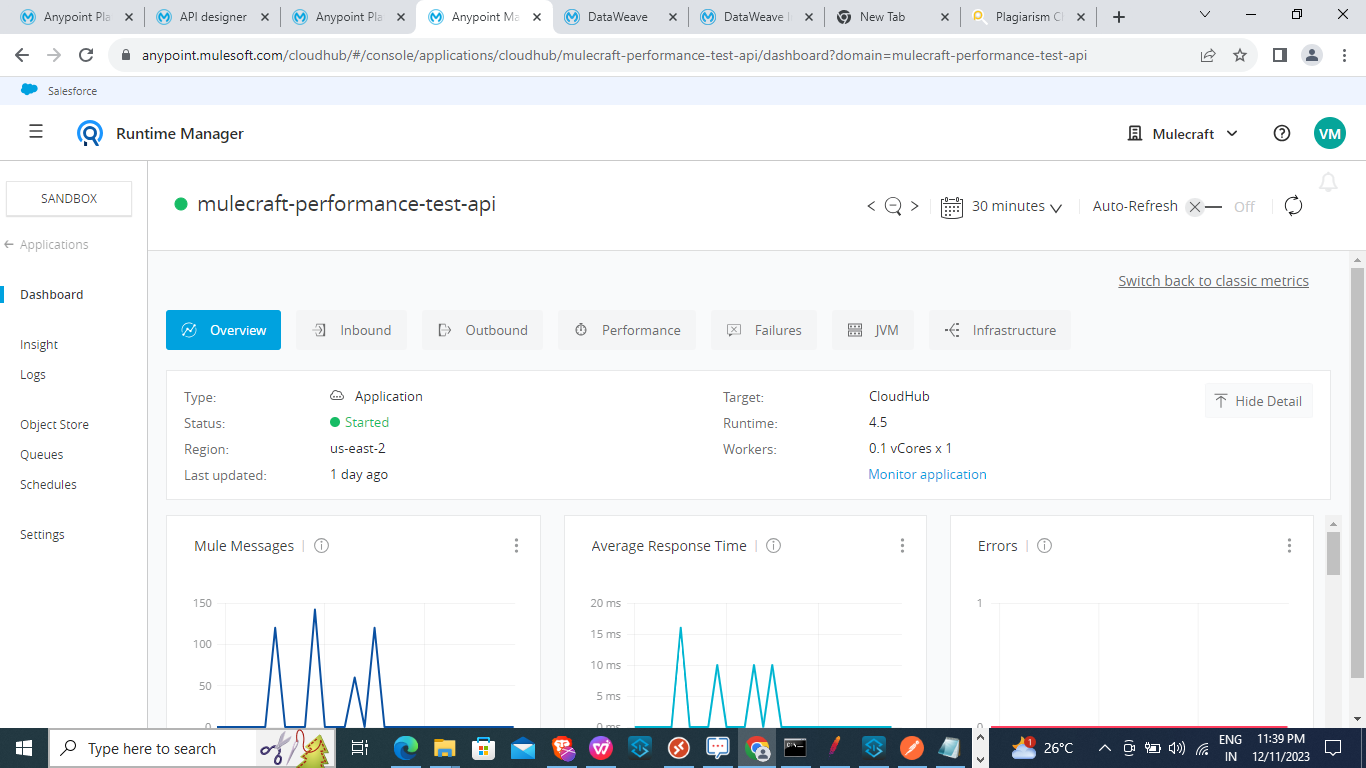
Create a Mule Application and Deploy it to CloudHub.
Configuration of Jmeter for API
- Install Jmeter. Apache Jmeter download link: http://jmeter.apache.org/download_jmeter.cgi
- After downloading Jmeter. You will find a zip file. You need to extract it and then navigate to the bin directory.
- Need to run the Jmeter according to the operating system. If you use windows you can run through the command prompt.
- After that you will experience the Jmeter UI like shown below.
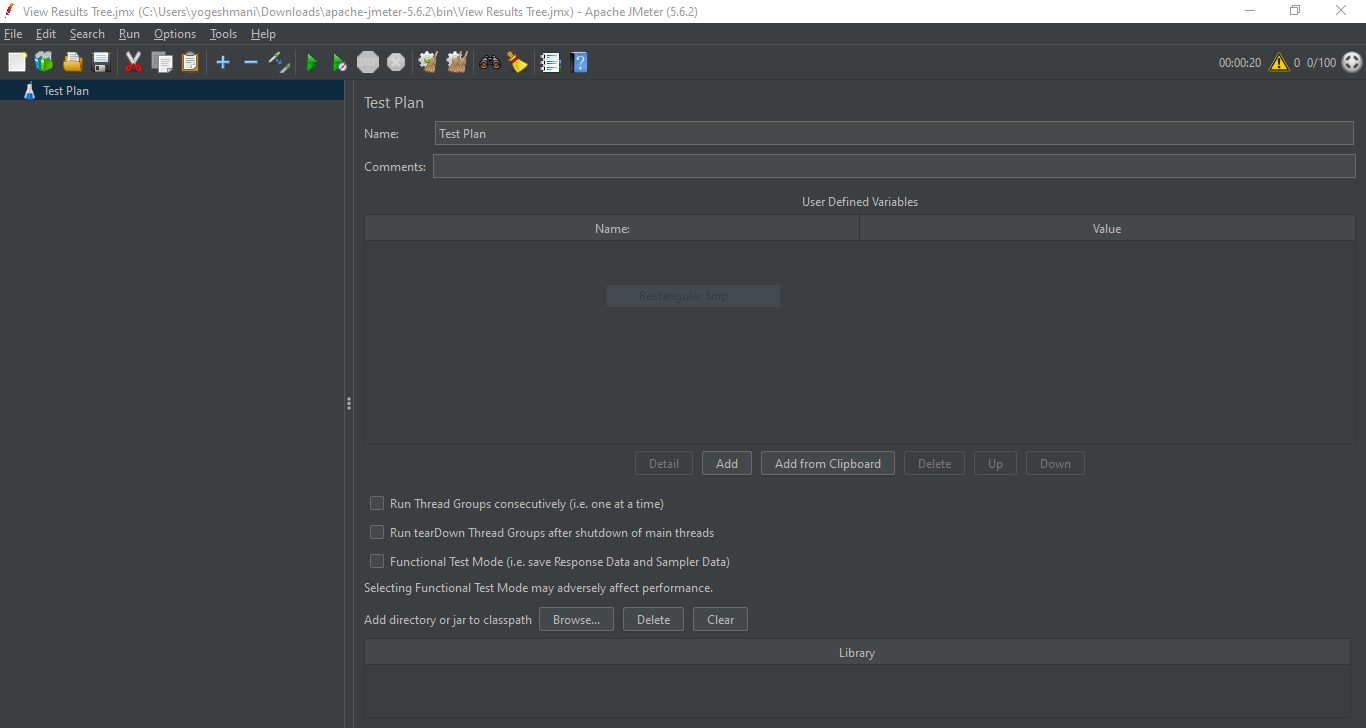
- Next create a test plan to start a load testing. And name it as you like. A test plan essentially outlines the scenarios and configurations for your performance testing.
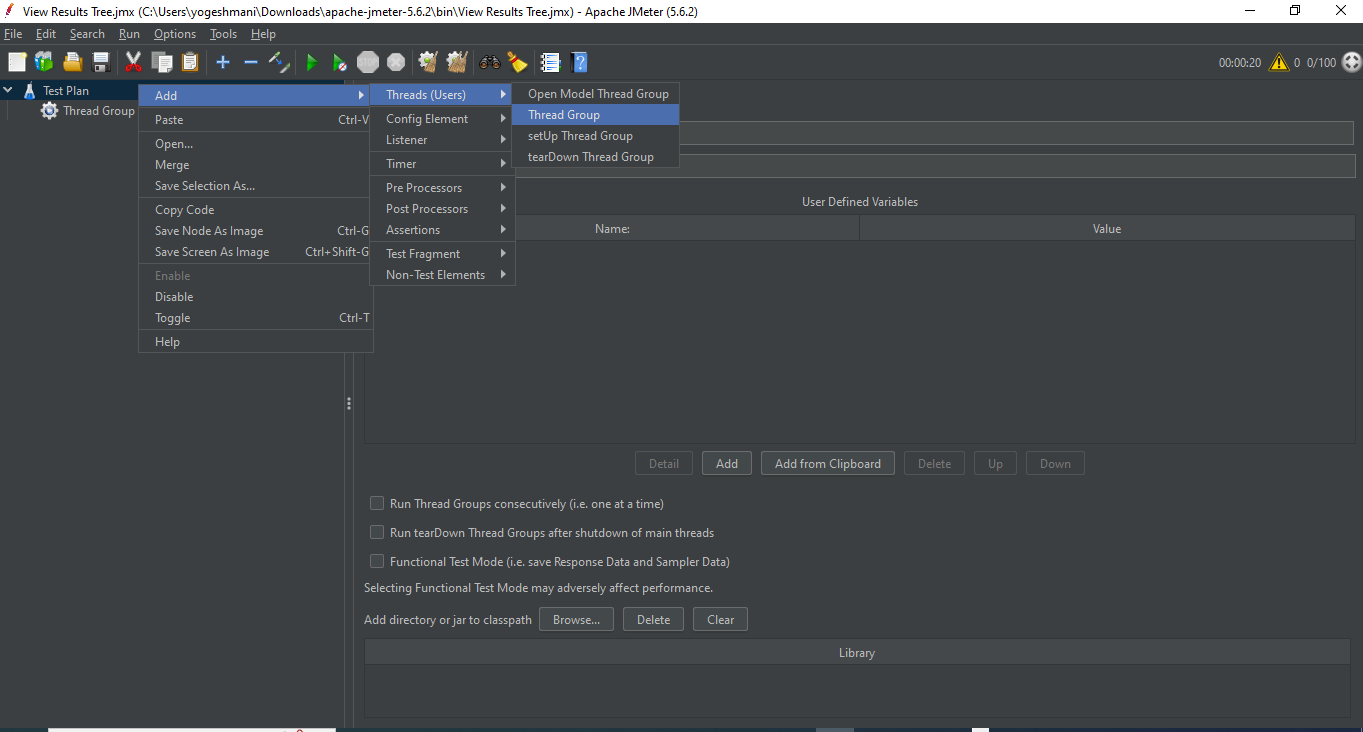
- Include a Thread Group in your Test plan. To include a new Thread Group in your Test Plan using Apache JMeter, you can initiate the process by right-clicking on the Test Plan, then selecting "Add," followed by "Threads (Users)," and finally choosing "Thread Group." In the context of performance testing, threads represent the users accessing the application simultaneously.
- After incorporating a Thread Group, you need to define the parameters for the virtual users, such as the number of threads and the ramp-up period, which specifies how gradually users are introduced.
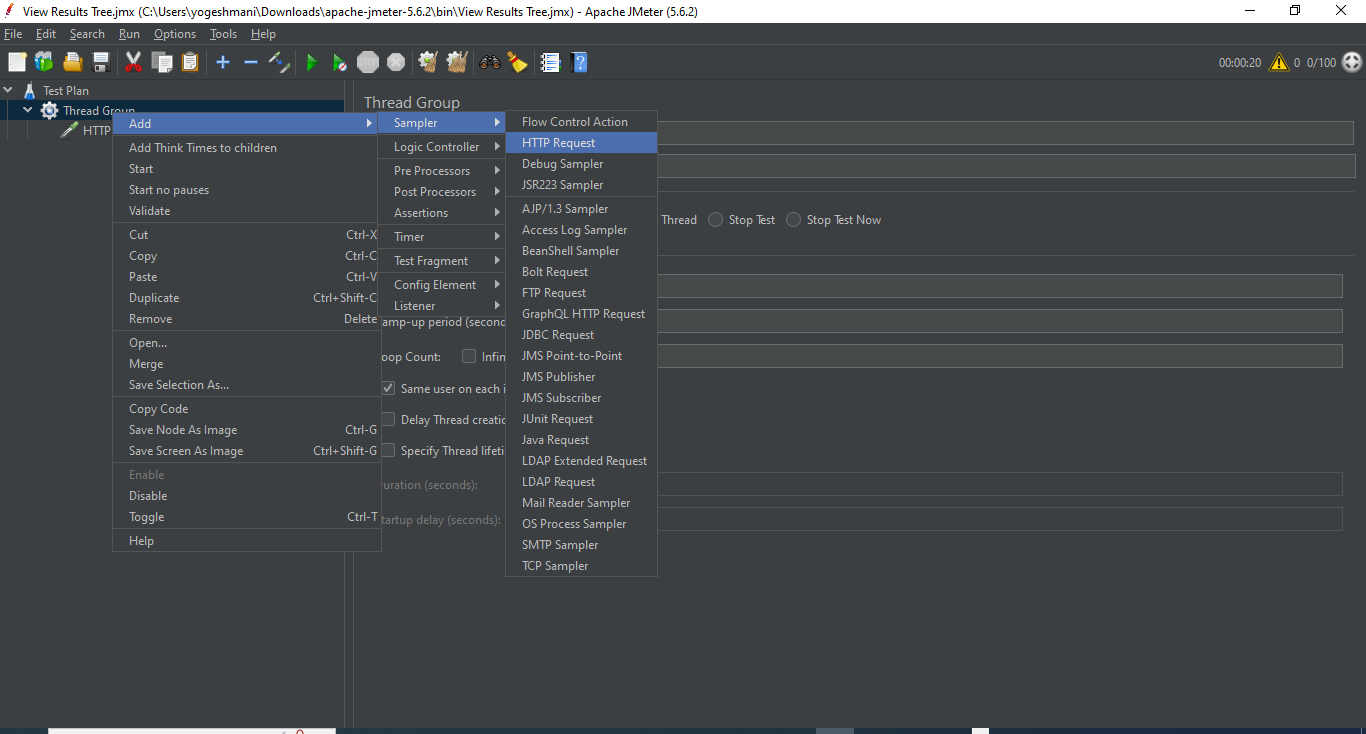
- Next, we'll incorporate a sampler to the specific request we intend to execute within the application during load testing. In this scenario, the application mandates an HTTP sampler. To configure this, follow the steps outlined below.
Right Click Thread Group > Add > Sampler > HTTP Request.
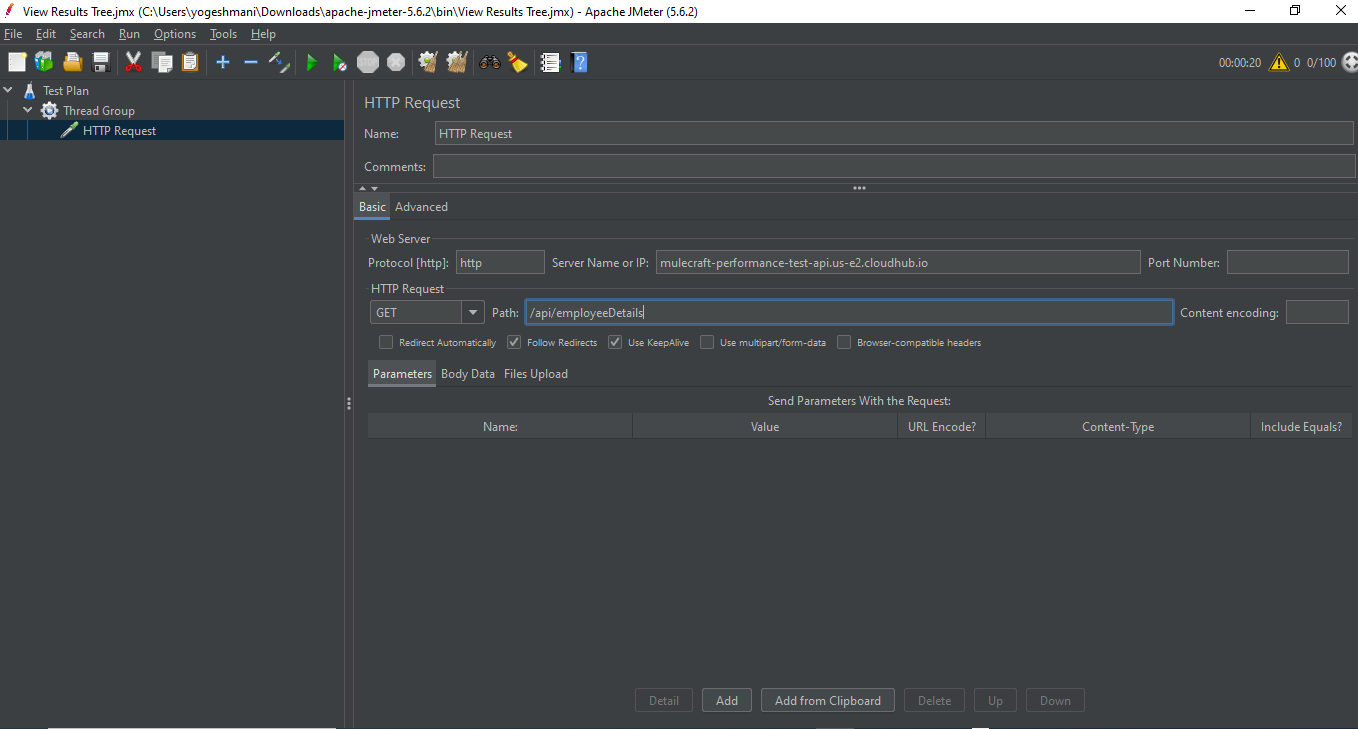
- Configure the properties like Protocol, Server Name, Port, Method and URI Path of the HTTP request according to the picture shown.
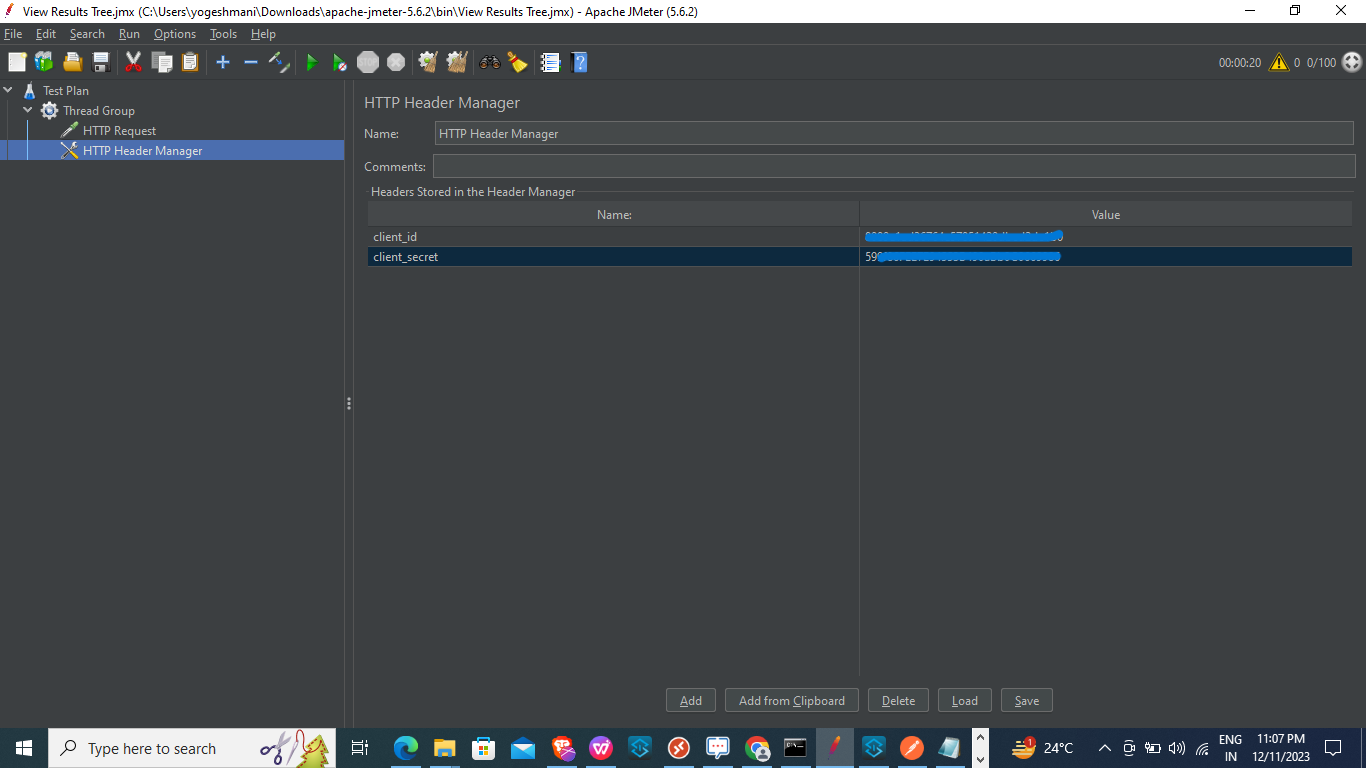
- You can add headers to your HTTP requests using the HTTP Header Manager.
Go to Add -> Config Elements -> HTTP Header Manager.
- We can make use of the listener components used to view and analyze the test results.
Go to Add -> Listener to choose the type of listener you want to add.
Common listeners include:
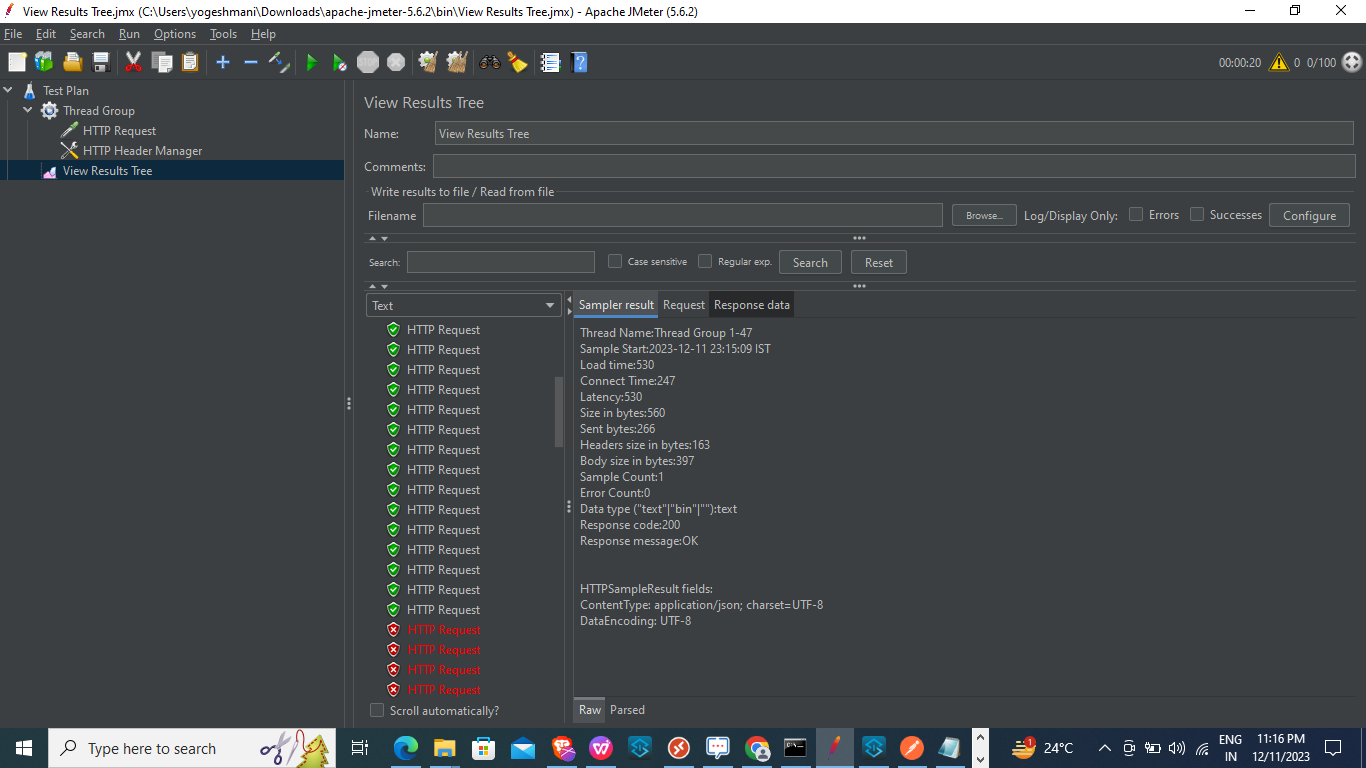
- View Results Tree: Displays results in a tree-like structure.
- Summary Report: Provides a summary of the test results.
- Aggregate Report: Shows aggregate results in a tabular format.
- Graph Results: Displays results in graphical format.
View Results Tree:
- The View Results Tree listener in Apache JMeter is a powerful component used for observing and analyzing detailed information about the requests and responses generated during a test.
- This listener provides a tree-like structure that displays a comprehensive view of the sample results, including the request and response details, headers, assertions and more.
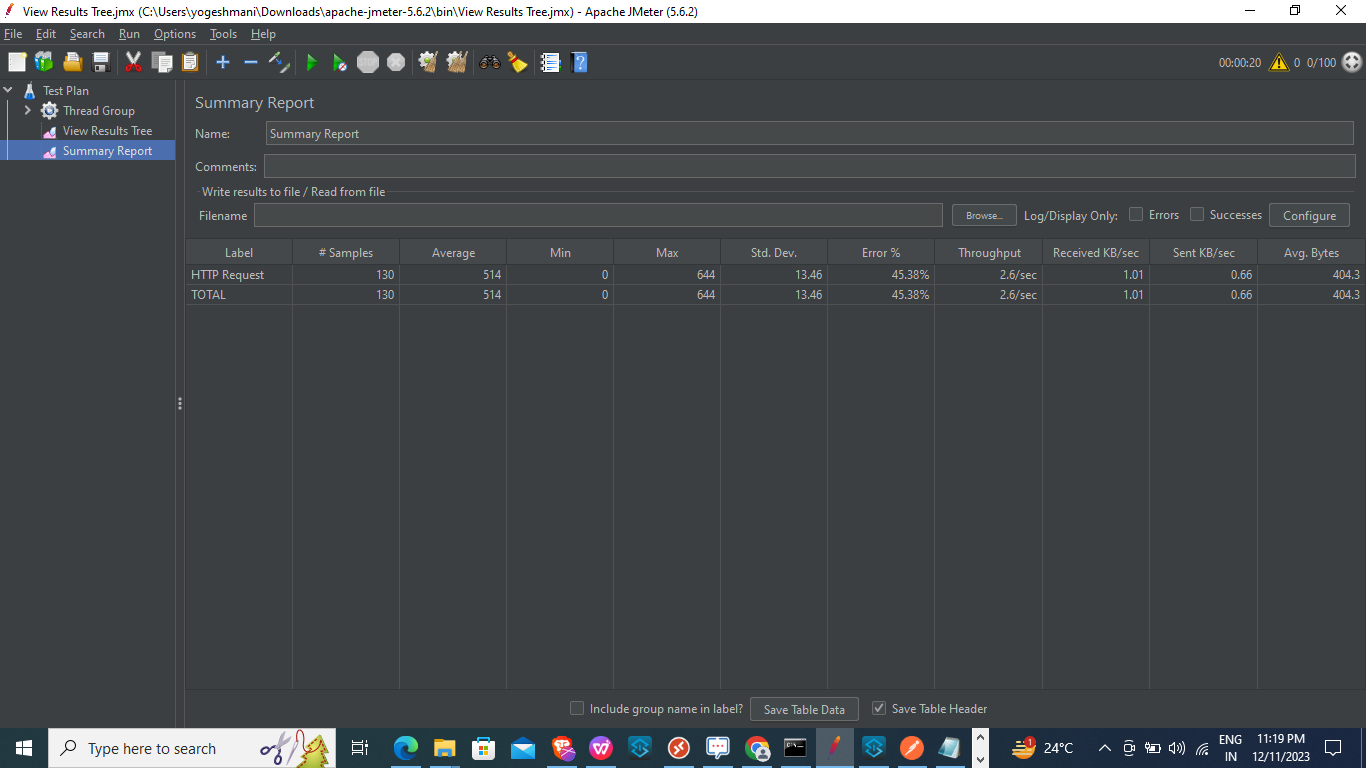
Summary Report :
- Summary Report listener is a component that provides a concise and aggregated summary of the test results. It presents key performance metrics in a tabular format, offering an overview of the test execution.
- This listener is particularly useful for quickly assessing the overall performance and identifying potential issues in a performance test.
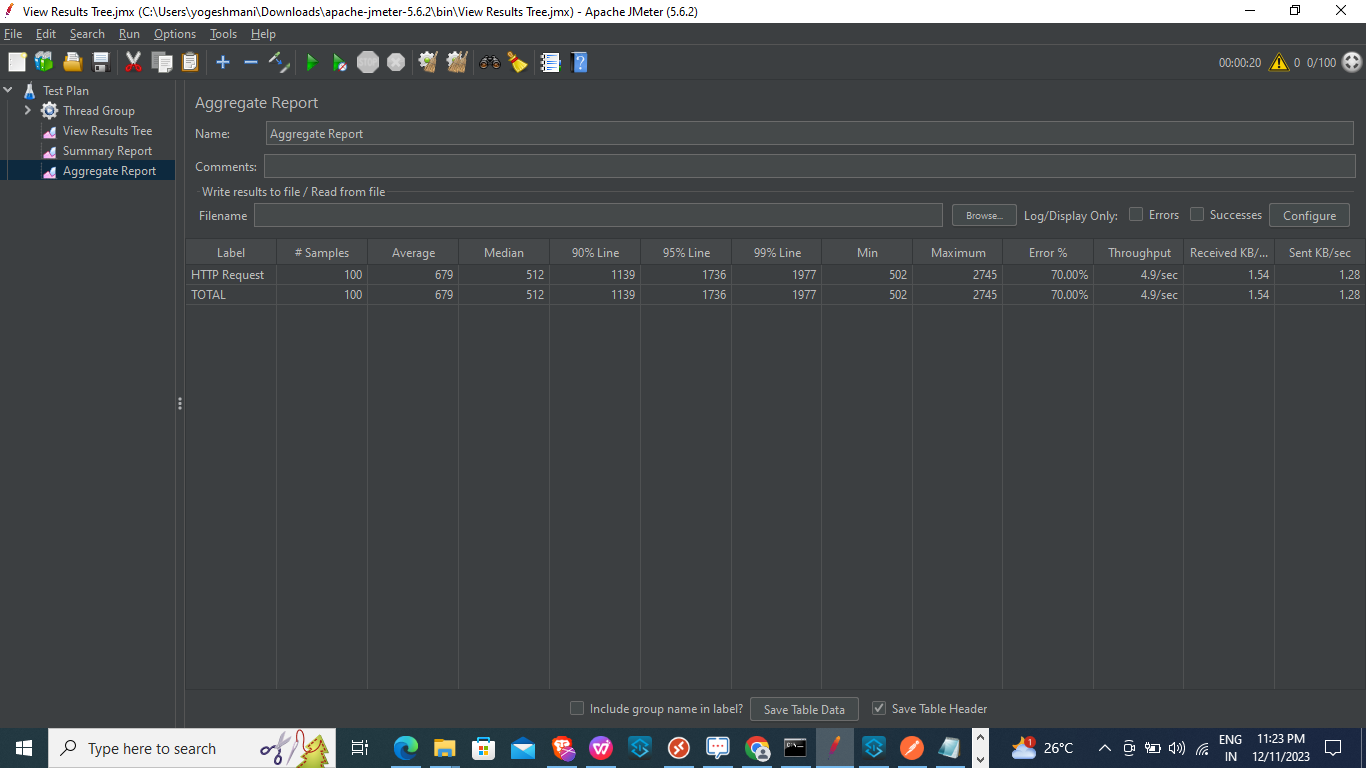
Aggregate Report:
- It is a reporting component that provides a more detailed and comprehensive overview of test results compared to the "Summary Report."
- It presents aggregated data in a tabular format, offering insights into the performance characteristics of a JMeter test.
- It is particularly valuable for in-depth analysis and performance tuning.
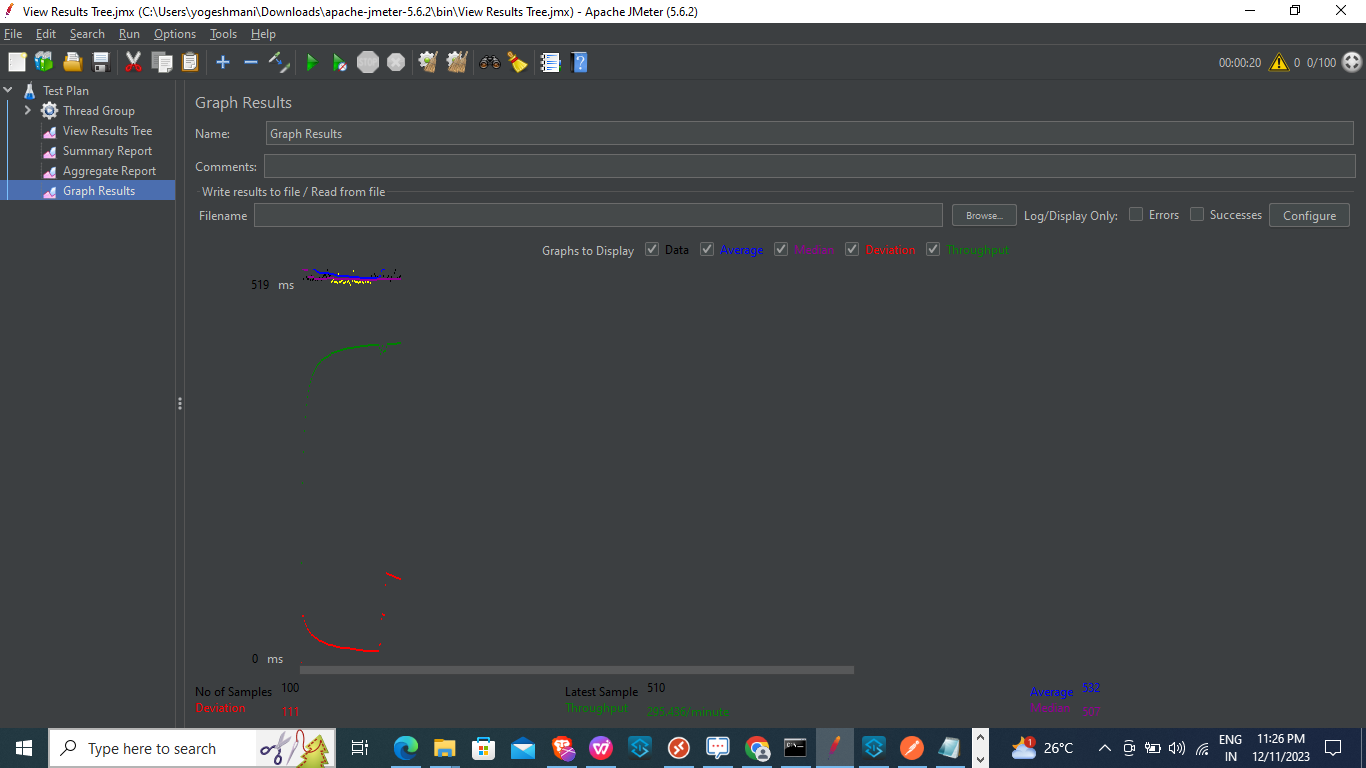
Graph Results:
- It acts as a visualization component that provides a graphical representation of key performance metrics during a test. It offers a dynamic and visual way to analyze trends and patterns in the data collected from JMeter test executions.
- This listener is particularly useful for gaining insights into performance fluctuations over time and identifying potential performance issues.
Conclusion:
In conclusion, Apache JMeter is a robust and widely-used open-source tool for load and performance testing. Its user-friendly interface, extensive protocol support and scalability make it a preferred choice for testing the performance of APIs.
JMeter's versatility, coupled with features like distributed testing, scripting capabilities, and effective reporting tools, allows testers and performance engineers to simulate realistic scenarios and assess the responsiveness and scalability of their systems. With its rich set of components and support for various protocols, JMeter remains a valuable resource for organizations seeking to ensure the reliability and optimal performance of their Mulesoft applications.