Real-time Insights Made Easy: Integrating Mule Application Logs with Splunk


Splunk
Splunk is a software platform designed for searching, monitoring, and analyzing machine-generated data. It is primarily used for collecting, indexing, and visualizing large volumes of data generated by various sources, including servers, applications, network devices, sensors, and more. Splunk is known for its capabilities in log management, security information and event management (SIEM), and data analytics.
Features
Log Management: Splunk can ingest log files from various sources and allow users to search, filter, and analyze log data in real-time. This is helpful for troubleshooting issues, monitoring system performance, and ensuring compliance with regulatory requirements.
Security and Compliance: Splunk is widely used for security monitoring and threat detection. It can correlate and analyze security events and logs to identify potential security threats and breaches. Splunk's security features make it a popular choice for SIEM solutions.
Data Visualization: Splunk provides powerful data visualization capabilities, allowing users to create dashboards and reports to gain insights from their data. Visualizations include charts, graphs, and maps that help users understand complex data sets.
Machine Learning and Analytics: Splunk offers machine learning and advanced analytics features to identify trends, anomalies, and patterns within data. These capabilities are valuable for predictive analytics and proactive problem-solving.
Alerting and Notifications: Users can set up alerts and notifications based on specific events or conditions in their data. This enables proactive monitoring and quick response to critical issues.
Data Integration: Splunk can integrate with a wide range of data sources, including databases, cloud services, and third-party applications. This makes it versatile for collecting and analyzing data from diverse environments.
Customization and Extensibility: Splunk can be customized and extended through apps and add-ons, allowing organizations to tailor it to their specific needs. There is also a large ecosystem of third-party apps and integrations available.
Splunk Setup
Click the link below ->
https://www.splunk.com/en_us/download.html
Download Splunk Enterprise –> click free trail –> create account –> download version.
After Download, click it -> Splunk Enterprise Installer -> tick (Check this box to accept the License Agreement) -> NEXT button –> Set your username and password –> click NEXT. Once the installation is done -> click FINISH.
http://localhost:8000 - Splunk URL for Login page.
MuleSoft Anypoint Studio logs to Splunk
Configure Logging in MuleSoft:
Open your MuleSoft project in Anypoint Studio.
Configure the logging framework to send logs to a file or console. You can use MuleSoft's default logger component or a custom logger configuration.
Now first deploy to Anypoint studio (observe your console carefully) once it's getting build it will show you the path where these logs are getting stored.
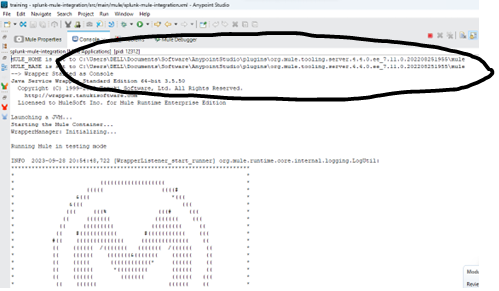
Once you run your Anypoint studio it shows you the path like given below.
C:\Users\DELL\Documents\Software\AnypointStudio\plugins\org.mule.tooling.server.4.4.0.ee_7.11.0.202208251955\mule
This is the path where the logs files are stored.
Note: You can see your logs in the given location. In the \mule folder, all the logs for the specific project are store in mule.ee file.
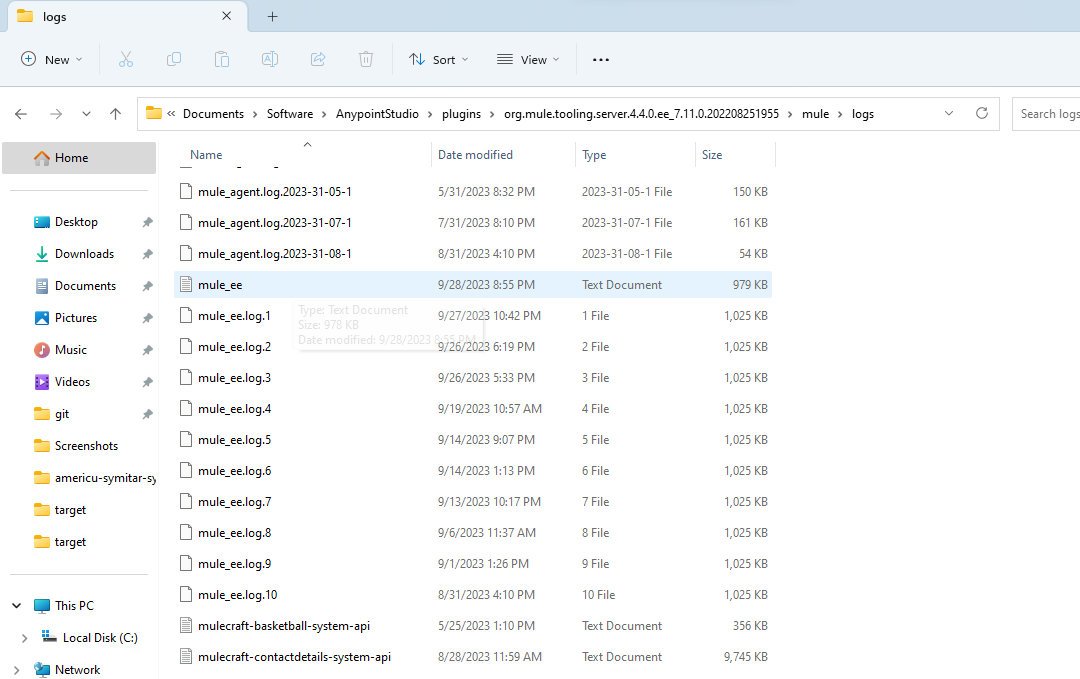
Test your application in postman and you could see a folder (based on your file name) is automatically created to store the logs.
Configure Setup in Splunk
-> Login into your Splunk
-> Go to Settings
-> Go to Data inputs
-> Click on Files & Directories
-> Click on New Local File & Directory
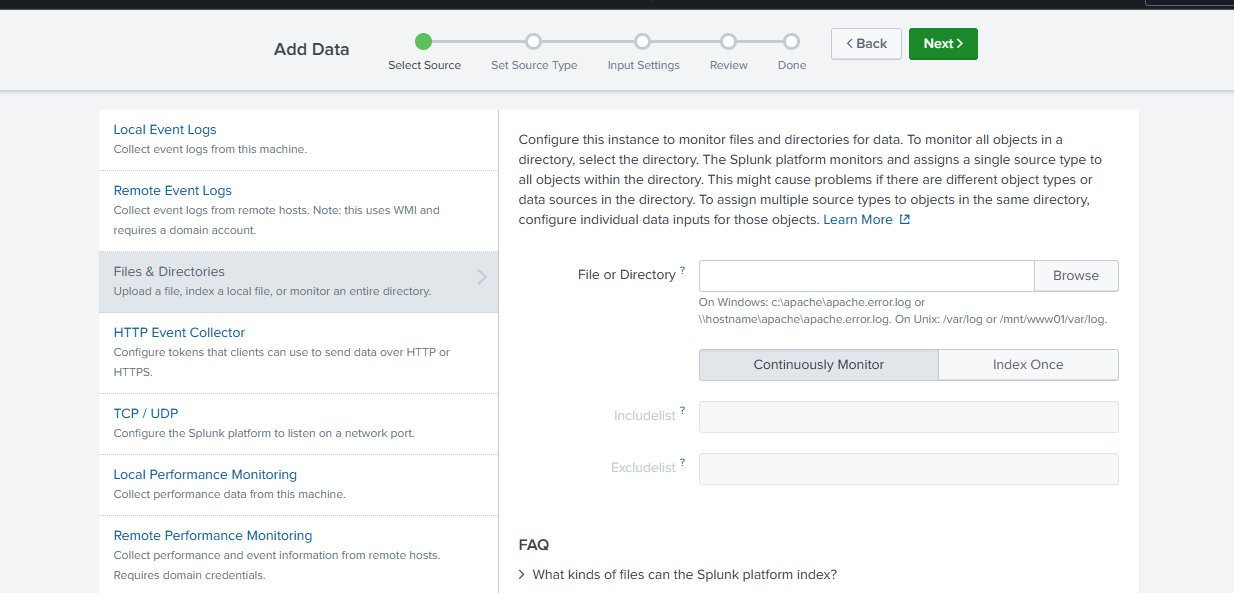
-> Click on Browse, enter the path of the log file. (C:\Users\DELL\Documents\Software\AnypointStudio\plugins\org.mule.tooling.server.4.4.0.ee_7.11.0.202208251955\mule)
-> Click on the next button.
-> Click on App Context choose Search & Reporting
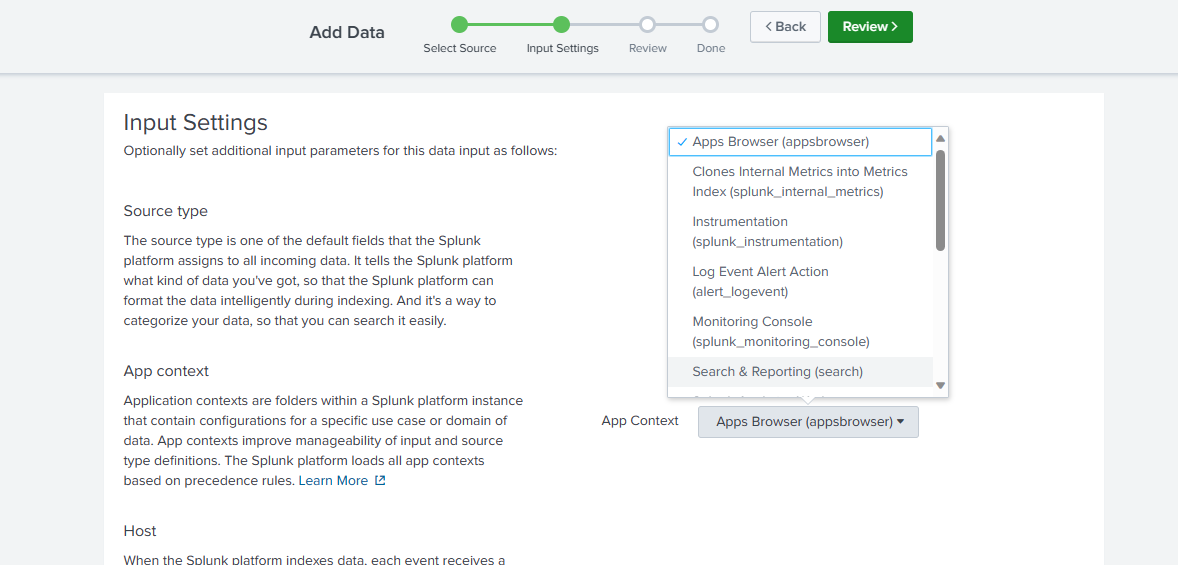
-> If you come down, choose the page index to create a new index button.
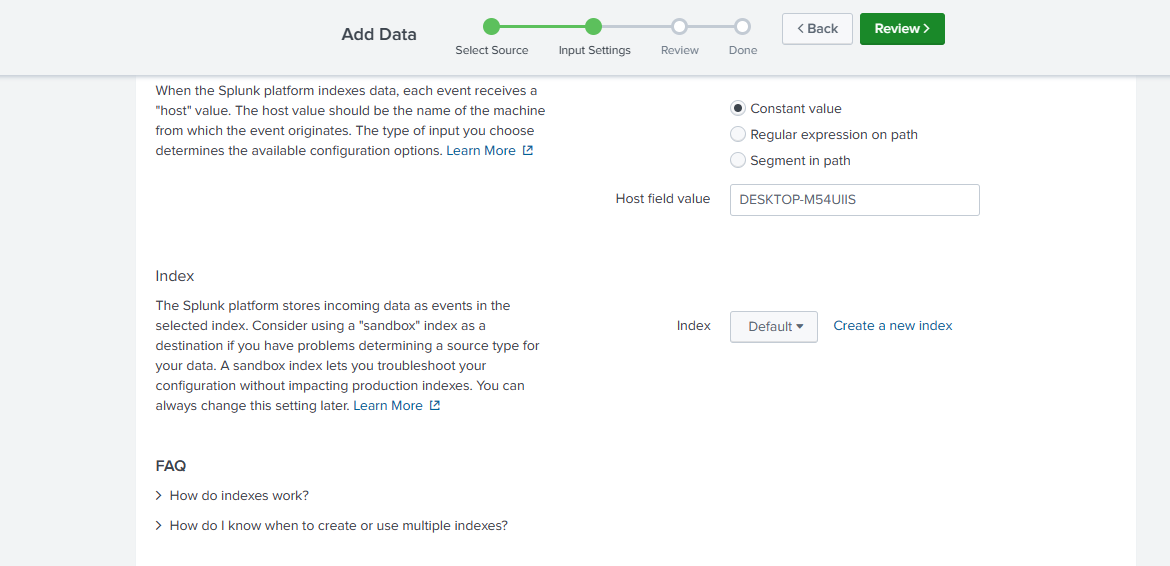
-> Give the index Name what you want and save it.
-> Go to Review and Submit.
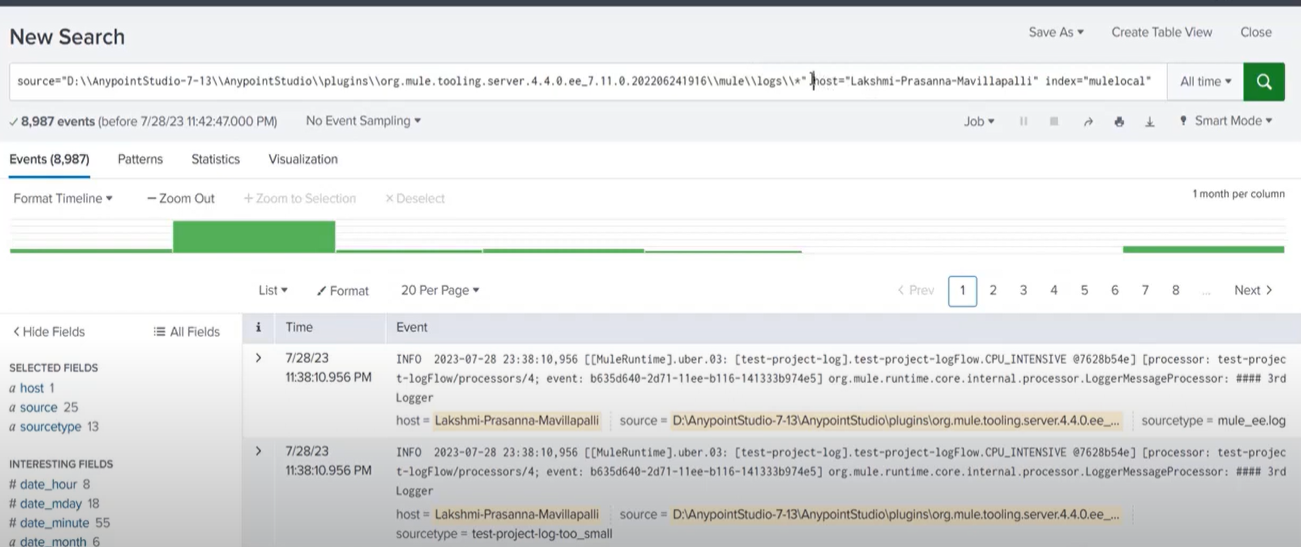
-> Click on Start Search.
Finally, it will give all the logs of Anypoint to Splunk.
Conclusion:
Integrating your MuleSoft application logs with Splunk offers a powerful solution for enhanced visibility, monitoring, and troubleshooting. With this seamless integration, you can gain valuable insights into your application's performance, detect anomalies, and proactively address issues. So, take the plunge and start reaping the benefits of this dynamic partnership today.